Forecasts
 Forecast Dashboard
Interactive Local Forecast Dashboard
Compare NWS, Open-Meteo, and discussion-driven forecasts.
Multi-model comparison
Area Forecast Discussion (AFD)
Chart.js visualizations
A live, browser-based dashboard that blends official NWS forecasts, model data, and
automated summaries into a single view. Includes 24-hour charts, AFD parsing, and alert
integration to help users interpret both the numbers and the “why” behind the forecast.
Winter
 Snowfall Outlook
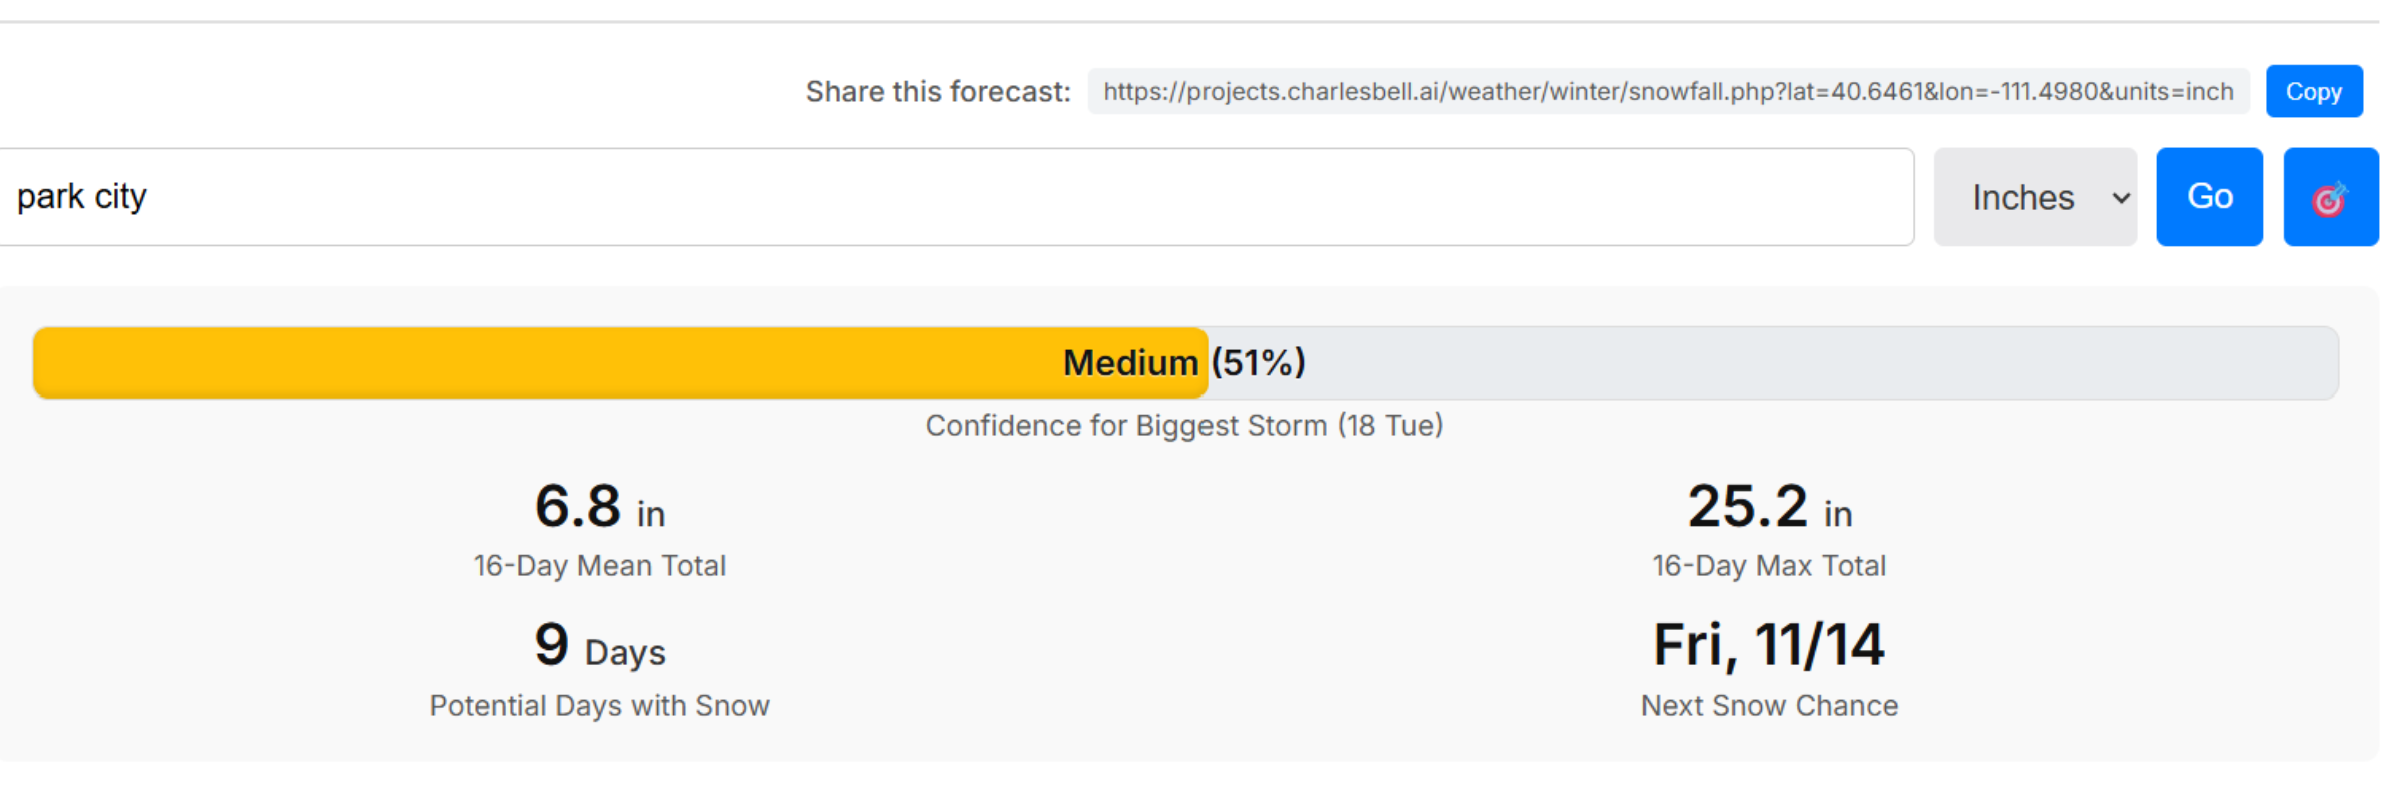
16-Day Snowfall Outlook
Probability-focused snow forecasts for key East Coast cities.
GFS · GraphCast · ECMWF
Ensemble thinking
Risk & worst-case framing
A specialized snowfall page designed to show more than a single “number.” Users see
modeled ranges, ensemble-informed risk, and potential worst-case outcomes for cities like
DC, NYC, and Philadelphia—emphasizing how uncertain winter storms can be.
Winter
 I-95 Snow Outlook
I-95 16-Day Snowfall Outlook
A 16-day look at snowfall risk along the I-95 corridor.
Corridor risk matrix
Best travel day
Leaflet map visualization
This tool provides a 16-day look at snowfall risk for over 20 stops along the I-95 corridor from Richmond, VA to Portland, ME. It aggregates multiple models (GFS, GEFS, etc.) to show daily probabilities and expected amounts in an interactive matrix and map.
Satellite
 Satellite Situational Awareness
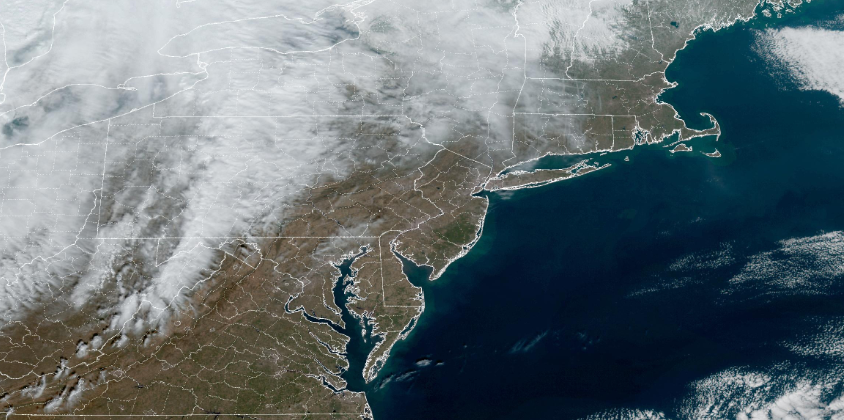
Northeast Satellite Situational Awareness
Real-time GOES-East satellite interpretation with AI discussion.
GOES-East GeoColor
Clean IR · Water Vapor · GLM
AI-generated discussion
An operational-style situational awareness dashboard for the Northeast U.S. combining
multiple GOES-East satellite products with an automatically generated meteorological
discussion. Designed to give forecasters and weather enthusiasts a quick, high-level
interpretation of evolving cloud patterns, storms, and synoptic features.
Tropical
 Tropical Tools
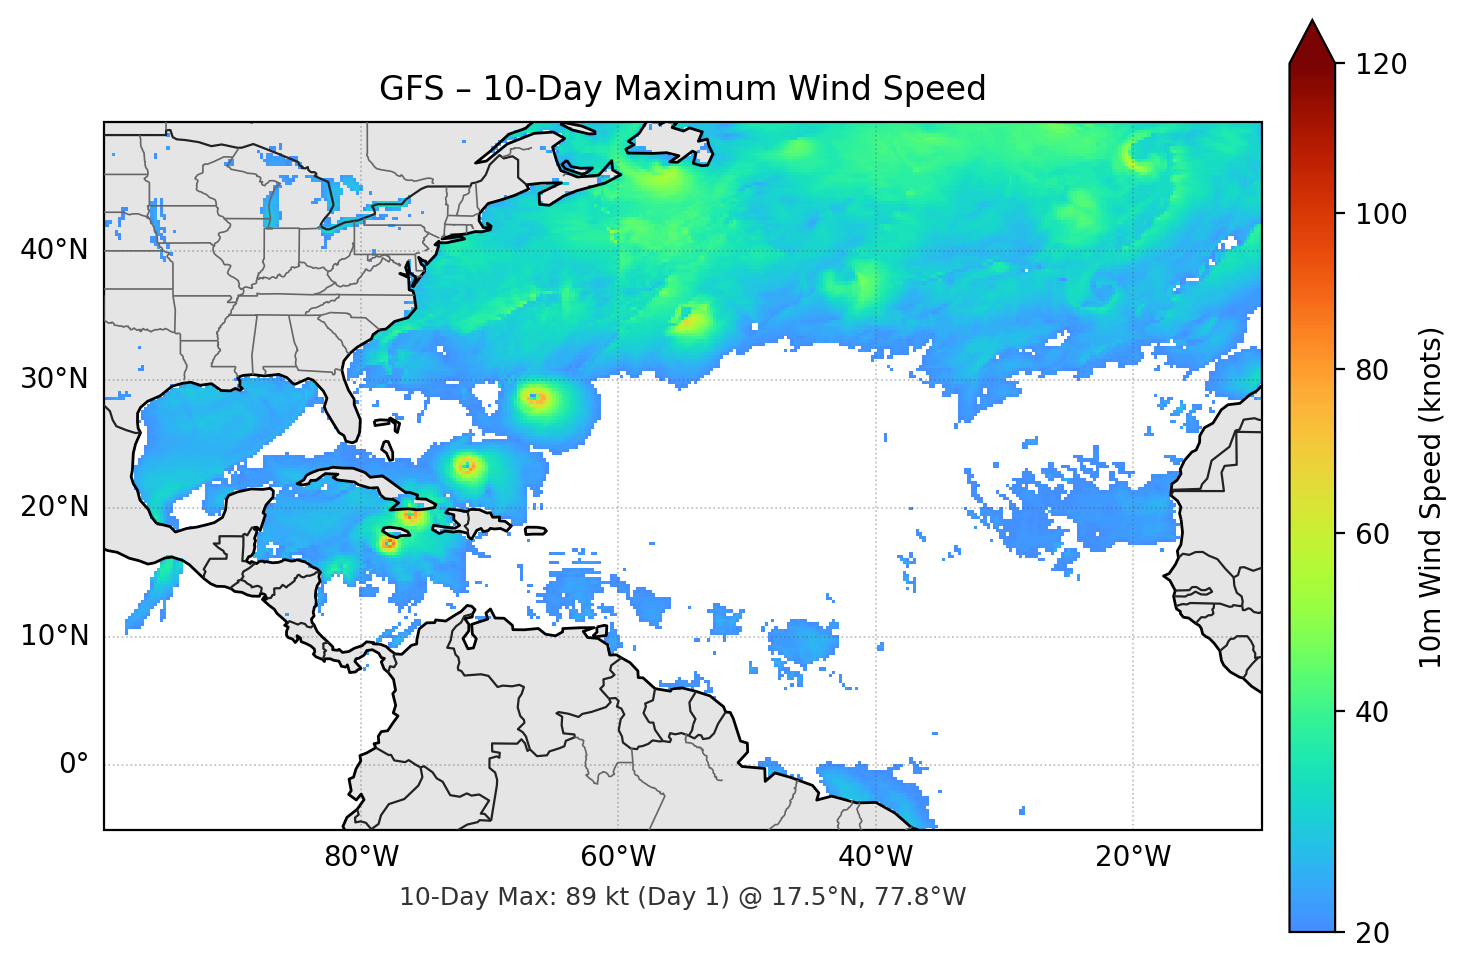
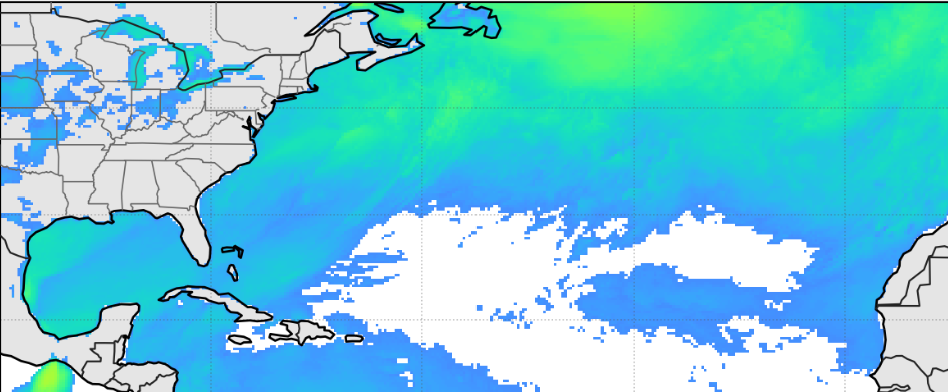
Tropical Weather Watch
10-day wind and track visuals for Atlantic & Caribbean systems.
GraphCast-GFS
GFS · ECMWF · AIFS
Ensemble winds & tracks
A set of dynamically generated maps and graphics highlighting 10-day tropical wind fields
and storm evolution over the western Atlantic and Caribbean. Built around automated
Python pipelines that pull, process, and render model output into clean, shareable images.